*************Forex or Forex Trading is an online business for currency trading that anobody can do from home computer *************

সোমবার, ফেব্রুয়ারী ২০, ২০১২

How to trade with BB-1

How to trade with Bollinger Bands

Price moves in upper bands channel – uptrend, lower - downtrend

It is very simple to identify dominating price direction by simply answering the question: in what part of the Bollinger bands the price is currently trading? If price stays above the middle line – in the upper
channel – we’ve got a prevailing uptrend. If below the middle line – in the lower channel – we have a prevailing downtrend.


And just in case you’ve missed the beginning of the trend, Bollinger bands can help you get in the trend with good risk to reward ratio on a pullback. Simply look for dips towards the middle Bollinger bands line and enter in the direction of the trend.

How to trade with BB-2

How to trade with Bollinger Bands

Low volatility, followed by high volatility breakouts

When Bollinger bands start to narrow down to the point when they are visually forming a neat tight range (measured no other way than by eye), as shown on the screenshot below, the situation signals
of an upcoming increase in volatility once market breaks outside the bands. It is similar to a quiet time before the storm.

The more time passes while price is contained within the narrow Bollinger bands range, the more aggressive and extensive breakout is expected.


How to trade with BB-3

How to trade with Bollinger Bands

Price moves outside the bands – trend continuation

When price moves and closes outside the Bollinger upper or lower bands, it implies a continuation of the trend. With it Bollinger bands continue to widen as volatility rises. But it is not always straight forward: at some point closing outside Bollinger bands will mean price exhaustion and upcoming trend reversal.

Bollinger bands alone are not able to identify continuation and reversal patterns and require support from other indicators, such as often RSI, ADX or MACD – in general all types indicators that highlight
markets from a different than volatility and trend prospective (momentum, volume, market strength, divergence etc).


How to trade with BB-4

How to trade with Bollinger Bands

Trend reversal patterns with Bollinger bands

As a rule, a candle closing outside Bollinger bands followed later by a candle closing inside the Bollinger bands serves as an early signal of forming trend reversal. It is, however, not a 100% assurance of an immediate trend reversal.


Since long aggressive trend develop not that often, there will be on general more reversals than continuation cases, still only filter signals form other indicators may help to spot true and false market tops and bottoms.

Speaking of the last, Bollinger bands are also capable of aiding double top and double bottom pattern recognition and trading.

How to trade with BB-5

How to trade with Bollinger Bands

W and M patterns with Bollinger bands

A double top or M pattern is a sell setup. With Bollinger bands it occurs when the following sequence take place:
- price penetrates the lower band,
- pulls back toward the middle line,
- a new subsequent low is formed, and this low is above the lower band and never has touched it.
- a setup is confirmed when price reaches and crosses the middle Bollinger line.

In fact, a very conservative trading approach requires price to cross and close on the other side of Bollinger bands middle line before the trend change is confirmed.

As you have probably noticed, the middle Bollinger bands line is simply a 20 SMA (default) line. This Simple Moving Average (SMA) is by itself a widely used stand alone indicator, which help Forex traders
identify prevailing trends and confirm trading signals.

Copyright © Myfxindicators.blogspot.com

Stochastic Indicator

Quick Summary

Trading with Stochastic indicator involves the following signals:

Stochastic lines cross — indicates trend change.
Stochastic readings above 80 level — currency pair is overbought,
Stochastic staying above 80 level — uptrend is running strong.
Stochastic exiting 80 level downwards — expect a correction down or beginning of a downtrend.
Same for readings below 20 level — currency pair is oversold,
staying below 20 — doentrend is running strong,
exiting upwards above 20 — expect an upward correction or a beginning of an uptrend.

Details

The idea behind Stochastic indicator.The main idea behind Stochastic indicator according to its developer, George Lane, lies in the fact that rising price tends to close near its previous highs, and falling price tends to close near its previous lows.

How to interpret Stochastic indicator

Stochastic is a momentum oscillator, which consists of two lines: %K - fast line, and %D - slow line. Stochastic is plotted on the scale between 1 and 100. There are also so called "trigger levels" that are added to the Stochastic chart at 20 and 80 levels. Those lines suggest when the market is oversold or overbought once Stochastic lines pass over them.

Stochastic indicator Method 1

How to trade with Stochastic indicator

Method 1. Trading Stochastic lines crossover
This is the simplest and common method of reading signals from Stochastic lines as they cross each other. Stochastic %K and %D line work similar to moving averages and:
when %K line from above crosses %D line downwards traders open Sell orders.
when %K line from below crosses %D line upwards traders open Buy orders.

Stochastic lines crossovers that happen above 80% level and below 20% level are treated as strongest signals, compare to crossovers outside those levels.

Traders may choose sensitivity of their Stochastics. The smaller the Stochastic parameters, the faster it will react to market changes, the more crossovers will be shown.

Sensitive Stochastic (for example 5, 3, 3) is useful for observing rapidly changing market trends. But because it is too choppy it should be traded in combination with other indicators to filter out Stochastic signals.


Stochastic indicator Method 2

How to trade with Stochastic indicator

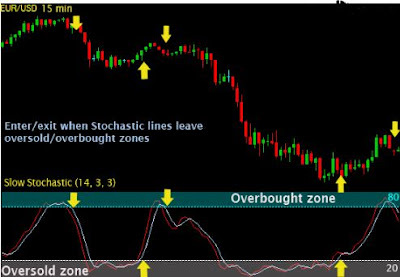
Method 2. Trading Stochastic oversold/overbought zones Stochastic by default has 80% level, above which market is treated as overbought, and 20% level, below which market is considered oversold.

It is important to remember that while in sideways moving market a single Stochastic lines crossover that occur above 80% or below 20% will most of the time result in a fast predictable trend change, in trending market could mean just nothing. When price is trending well, Stochastic lines may easily remain in overbought/oversold zone for a long period of time while crossing there multiple times.

That’s why a method of trading overbought/oversold zones stands up. The rules here are to wait until Stochastic lines after being in overbought/oversold zone come out from it. E.g. When stochastic was trading for some time in overbought zone – above 80% level, traders wait for the lines to slide down and eventually cross 80% level downwards before considering to take Short positions. Opposite for Long positions: wait till Stochastic lines come into the oversold zone (below 20% level); wait further until Stochastic lines eventually cross 20% level upwards; initiate a buy order once Stochastic lines are firmly set, e.g. a trading bar is closed and Stochastic lines cross over 20% mark is fixed.

Stochastic indicator Method 3

How to trade with Stochastic indicator

Method 3. Trading Stochastic divergence Traders are looking for a divergence between Stochastic and the price itself. At times when the price is making new lows while Stochastic produces higher lows creates dissonance in the picture. It is called divergence. Divergence between price and Stochastic readings suggest a forming weakness of a main trend and therefore its possible correction.


CSI theory

Commodity Selection Index theory

CSI combines 4 factors, which determine the best commodities for trading.
CSI suggest that the best commodities are:

- high in directional movement (DMI indicator value)
- high in volatility (Volatility Index value and ATR)
- have reasonable margin requirements (relative to directional movement & volatility)
- have reasonable commission rates

How to trade with CSI

Wilder's approach is to trade commodities with high CSI values (relative to other commodities).
A high CSI rating demonstrates that the commodity has strong volatility characteristics and is trending.
Such commodities with high CSI rating are very volatile, and have the potential to make the fastest profits in the shortest period of time.

CSI formula

Commodity Selection Index formula

CSI calculation example

CSI calculation example


Although high CSI values imply trending markets characteristics, the indicator is designed for short-term traders who can handle the risks associated with highly volatile markets.

MACD

MACD Quick Summary

MACD is the simplest and very reliable indicators used by many Forex traders.
MACD (Moving Average Convergence/Divergence) has in its base Moving Averages.
It calculates and displays the difference between the two moving averages at any time. As the market moves, moving averages move with it, widening (diverging) when the market is trending and moving
closer (converging) when the market is slowing down and possibility of a trend change arise.

Trading with MACD indicator includes the following signals:

MACD lines crossover — a trend is changing
MACD historam staying above zero line — market is bullish, below — bearish.
MACD histogram flipping over zero line — confirmation of a strength of a current trend.
MACD histogram diverges from price on the chart — signal of an upcoming reversal.

Basics behind MACD

Basics behind MACD indicator

Standard indicator settings for MACD (12, 26, 9) are used in many trading systems, and these are the setting that MACD developer Gerald Appel has found to be the most suitable for both faster and slower moving markets. In order to get a more responsive and faster performance from MACD one can can experiment with lowering MACD settings to, for example, MACD (6, 12, 5), MACD (7, 10, 5), MACD (5, 13, 8) etc.
These custom MACD settings will make indicator signal faster, however, the rate of false signals is going to increase.

MACD indicatoris based on Moving Averages in their simplest form. MACD measures the difference between faster and slower moving average: 12 EMA and 26 EMA (standard).

MACD line is created when longer Moving Average is subtracted from shorter Moving Average. As a result a momentum oscillator is created that oscillates above and below zero and has no lower or upper limits. MACD also has a Trigger line. Combined in a simple lines crossover strategy, MACD line and trigger line crossover outperforms EMAs crossover.

Besides being early on crossovers MACD also is able to display where the chart EMAs have crossed: when MACD (12, 26, 9) flips over its zero line, if indicates that 12 EMA and 26 EMA on the chart have crossed.


MACD indicator work

How does MACD indicator work

If to take 26 EMA and imagine that it is a flat line, then the distance between this line and 12 EMA would represent the distance from MACD line to indicator's zero line. The further MACD line goes from zero line, the wider is the gap between 12EMA and 26 EMA on the chart. The closer MACD moves to zero line, the closer are 12 and 26 EMA.
MACD histogram measures the distance between MACD line and MACD trigger line.


MACD indicator Formula

                                         MACD indicator Formula
MACD = EMA(Close)period1 - EMA(Close)period2
Signal Line = EMA(MACD)period3

where
period1 = standard settings are 12 bars
period2 = standard 26 bars
perid3 = standard 9 bars

The following are the steps to calculate MACD

1. Calculate the 12-days EMA of closing price
2. Calculate the 26-days EMA of closing price
3. MACD = 12-days EMA - 26-days EMA
4. Signal Line = 9-days EMA of MACD

Formula for EMA

EMA = (SC X (CP - PE)) + PE

SC = Smoothing Constant (Number of days)
CP = Current Price
PE = Previous EMA

Trading MACD Divergence

                                                       Trading MACD Divergence

MACD indicator is famous for its MACD Divergence trading method.

Divergence is found by comparing price shifts on the chart and MACD values. MACD Divergence phenomenon occur as a result of shifting forces on the Forex market. For example, while Sellers may seem to be dominating the market at the moment and price continues to trend down, there already might be signals for an overall weakening of Sellers power. This key warning moments can be observed with MACD indicator. What Forex traders would see is that despite price making new Lower Lows, MACD doesn't confirm that and instead registers a Higher Low, signaling that Sellers are running out of steam and a trend change is on its way.

Opposite will be true for Buyers.

MACD Divergence

How to trade MACD Divergence

When MACD line (on our screenshot it is a blue line) crosses Signal line (red dotted line) - we have a point (top or bottom) to evaluate. With two most recent MACD line tops or bottoms find corresponding tops/bottoms on the price chart. Connect MACD tops/bottoms and chart tops/bottoms. Evaluate the lines received, as shown on the larger screenshot (click on the small picture to enlarge).


 With MACD divergence spotted Enter the market when MACD line crosses over its zero point. Another entry strategy is to find 2 most recent swings high or low on the chart and draw a tr trough them; and then set an Entry order on the breakout of that trend line.

MACD divergence trading method used not only to predict trend turning points, but also for trend confirmation. A current trend has high potentials to continue unchanged in case no divergence between MACD and price was established after most recent tops/bottoms evaluation.

ZigZag


ZigZag
The Zigzag indicator is a series of trend lines connecting significant peaks and foundations at the price plot. Minimum price change parameter determines the percentage for the price to move in order to form a new "Zig" or "Zag" line. This indicator eliminates those changes on the plot we analyze that are less than the given v alue. Therefore, the Zigzag reflects significant changes only.

In most cases, we use Zigzag to facilitate the perception of plots as it shows only the most important changes and turns. You can also reveal Elliot Waves and various figures on the plot with its aid.


It is important to understand that the last section of the indicator may vary depending on the changes of data you analyze. This is one of those indicators, where a change of securities price can provoke a change of the previous value. This ability to correct its values by the following price changes makes Zigzag a perfect tool for analyzing price changes that have already happened. Therefore, you should not try to create a trade system basing on the Zigzag. It is more suitable for analyzing historical data than for making prognoses.

Average Directional Movement


Average Directional Movement Index (ADX)

Average Directional Movement Index Technical Indicator (ADX) helps to determine if there is a price trend. It was developed and described in detail by Welles Wilder in his book "New concepts in technical trading systems".

The simplest trading method based on the system of directional movement implies comparison of two direction indicators: the 14-period +DI one and the 14-period -DI. To do this, one either puts the charts of indicators one on top of the other, or +DI is subtracted from -DI. W. Wilder recommends buying when +DI is higher than -DI, and selling when +DI sinks lower than -DI.

To these simple commercial rules Wells Wilder added "a rule of points of extremum". It is used to eliminate false signals and decrease the number of deals. According to the principle of points of extremum, the "point of extremum" is the point when +DI and -DI cross each other. If +DI raises higher than -DI, this point will be the maximum price of the day when they cross. If +DI is lower than -DI, this point will be the minimum price of the day they cross.

The point of extremum is used then as the market entry level. Thus, after the signal to buy (+DI is higher than -DI) one must wait till the price has exceeded the point of extremum, and only then buy. However, if the price fails to exceed the level of the point of extremum, one should retain the short position.


Calculation:

ADX = SUM[(+DI-(-DI))/(+DI+(-DI)), N]/N

Where:
N — the number of periods used in the calculation.

Accumulation Swing Index


Accumulation Swing Index (ASI)

ASI was created by Wales Wilder as an ordinary fluctuations indicator that gets signals from previous maximums and minimums of price. Once, Wilder said: "Somewhere amidst the maze of Open, High, Low and Close prices is a phantom line that is the real market." What helps us reveal this phantom line is the cumulation index.

In his book "New Concepts in Technical Trading Systems", Wilder describes the indicator this way: "When the Index is plotted on the same chart as the daily bar chart, trend lines drawn on the ASI can be compared to trend lines drawn on the bar chart. For those who know how to draw meaningful trend lines, the ASI can be a good tool to confirm trend-line breakouts. Often erroneous breaking of trend lines drawn on bar charts will not be confirmed by the trend lines drawn on the ASI. Since the ASI is heavily weighted in favor of the close price, a quick run up or down during a day's trading does not adversely affect the index."

With the ASI attempting to show the "real market," it closely resembles actual prices. This allows usage of classic support/resistance analysis on the ASI. Standart analysis involves looking for breakouts, new highs and lows, and divergences. Wilder points out the following characteristics of ASI:

It gives quantitation parameters of price changing;

It shows the turning points of short-term changing;

It gives a possibility to understand the real power and trend of the market.


Calculation:

SI(i) = 50*(CLOSE(i-1) - CLOSE(i) + 0,5*(CLOSE(i-1) - OPEN(i-1)) + 0,25*(CLOSE(i) - OPEN(i)) / R)*(K / T)

ASI(i) = SI(i-1) + SI(i)

Where:
SI (i) — current value of Swing Index technical indicator;
SI (i - 1) — stands for the value of Swing Index on the previous bar;
CLOSE (i) — current close price;
CLOSE (i - 1) — previous close price;
OPEN (i) — current open price;
OPEN (i - 1) — previous open price;
R — the parameter we get from a complicated formula based on the ratio between current close price and previous maximum and minimum;
K — the greatest of two values: (HIGH (i - 1) - CLOSE (i)) and (LOW (i - 1) - CLOSE (i));
T — the maximum price changing during trade session;
ASI (i) — the current value of Accumulation Swing Index.

Bollinger Bands (BB)

Bollinger Bands (BB)

Bollinger Bands Technical Indicator (BB) is similar to Envelopes. The only difference is that the bands of Envelopes are plotted a fixed distance (%) away from the moving average, while the Bollinger Bands are plotted a certain number of standard deviations away from it. Standard deviation is a measure of volatility, therefore Bollinger Bands adjust themselves to the market conditions. When the markets become more volatile, the bands widen and they contract during less volatile periods.

Bollinger Bands are usually plotted on the price chart, but they can be also added to the indicator chart (Custom Indicators). Just like in case of the Envelopes, the interpretation of the Bollinger Bands is based on the fact that the prices tend to remain in between the top and the bottom line of the bands. A distinctive feature of the Bollinger Band indicator is its variable width due to the volatility of prices. In periods of considerable price changes (i.e. of high volatility) the bands widen leaving a lot of room to the prices to move in. During standstill periods, or the periods of low volatility the band contracts keeping the prices within their limits.

The following traits are particular to the Bollinger Band:

1.abrupt changes in prices tend to happen after the band has contracted due to decrease of volatility.

2.if prices break through the upper band, a continuation of the current trend is to be expected.

3.if the pikes and hollows outside the band are followed by pikes and hollows inside the band, a reverse of trend may occur.

4.the price movement that has started from one of the band’s lines usually reaches the opposite one. The last observation is useful for forecasting price guideposts.


Calculation:
Bollinger bands are formed by three lines. The middle line (ML) is a usual Moving Average.
ML = SUM [CLOSE, N]/N

The top line, TL, is the same as the middle line a certain number of standard deviations (D) higher than the ML.
TL = ML + (D*StdDev)

The bottom line (BL) is the middle line shifted down by the same number of standard deviations.
BL = ML — (D*StdDev)


Where:
N — is the number of periods used in calculation;
SMA — Simple Moving Average;
StdDev — means Standard Deviation.

StdDev = SQRT(SUM[(CLOSE — SMA(CLOSE, N))^2, N]/N)

Pivot Trading Tips


Tricks/Techniques in Pivot point trading

Now, knowing the basics we can move onto Forex tricks and tips we prepared for you to enhance your trading success with Pivots.

Pivot Trick 1 — early bird gets all worms. Early hours are where all support/resistance levels are tested. Later the market usually makes adjustments only. Early hours start from the first minutes of the new day! Sleep in and you've missed it.

Pivot Trick 2 — As we promised — Timing. London time and New York Time, think global. While we use New York time (EST) other traders are trading in other time zones. It is worth considering at least London market — one of the biggest currency markets. They use GMT. Therefore, their
Pivots are calculated 5 hours later than ours, means they use different data and price ranges. Wouldn't it be helpful updating Pivots according to their time 5 hours later and see enhanced picture of the market? Yes, it would pay off!

Pivot Trick 3 — in case you prefer quick entries close to Pivot levels and like to use limit orders for that, keep in mind that setting positions too close to any Pivot level may put you in the situation when the order is triggered but the price eventually closes on the other side and moves against you. That's why we don't use any preset orders; we wait for the bounce-off or break-through to happen and then manually open new trade at current market price.

Pivot Trick 4 — when Pivot Point is passed / crossed, price will in 95% of the cases hit first Support or Resistance level, what does it mean? — Sure fire profits. If you choose to take your profits at R1 or S1 level you will be winning it day after day! On the other hand, you may often see that during some other days your were exiting too early as the price moved further in your direction after you exited. It's up to you: opting for predictable profits or going for bigger dreams.

Pivot Trick 5 — mid-lines can be used for setting stop loss orders. Going Long at Pivot Point, set your stop loss order not right below the Pivot Point but below the mid-point between the Pivot Point and S1. This will give you a better chance to survive if Pivot Point gets "poked".

Pivot Trick 6 — if during the day you spot congestion around one of the Pivot levels, use it to your advantage: set entry order on the break out of this congestion and just over the Pivot level which price is trying to concur.

Pivot Tip 7 — if the market tried, but wasn't strong enough to reach R1 / S1 level and is already attacking Pivot Point to pull through on to the other side, be ready for trend change. Give the price chance to confirm its intentions by actually closing on the other side of the Pivot Point and shoot for the profits again setting the target at the first support/resistance level.

Pivot Tip 8 — we keep on saying that entering near the Pivot Point and then setting targets and the first support/resistance level is the easiest and the safest way to get sure profits. What can help you to pick much better trades is looking at the amount of pips you can earn in each trade. Simply by analyzing the distance from the point you plan to enter to the next S1/R1 level you can tell if the trade worth attempting. If the amount of pips is very small it is probably not worth trading. This way you save yourself from taking unnecessary risks of losing money on a little-to-nothing promising trades.

Pivot Tip 9 — by the time price reaches R2, R3 or S2, S3 the market will already be overbought or oversold and these levels should be used for exits rather than entries.

Pivot Tip 10 — How to calculate pivot points for Monday? To calculate Pivot points for Monday we use time from midnight EST on Friday to midnight EST on Sunday.

I hope you enjoyed studying Pivot points with my new blog.
I wish you all the best in your Forex trading career!

রবিবার, ফেব্রুয়ারী ১৯, ২০১২

Pivot Points work


Why do Pivot Points work?

The whole Pivot point trading technique is based on two main market concepts: existence of support and resistance. These two tendencies form the core of the market moves and therefore receive full attention from the vast majority of professional traders who trade on behalf of all kinds of large, medium, small financial institutions, funds as well as for themselves.

Because Pivot points are easy to calculate, millions of automated Forex trading systems in the world automatically execute buy / sell orders analyzing the market moves in relation to the Pivot points.

Also, there are very little variations that can take place when calculating Pivot points (those are only timing factors, but even then pivot points can quite often suggest the same data).
These precision in targets and mutual "agreement" among traders on certain key levels for the day cause the market to really shift, turn and move as huge percentage of traders pull in the same direction using basic Pivot points trading rules.

With EMAs crossing, for example, every trader can set different indicators and thus timing and reaction will not be so well coordinated. Also take Fibonacci, where for each time frame traders pull their own Fibonacci levels, same for trend lines — there are as many opinions out there as traders trading Forex. But when it comes to Pivot points, no matter what chart you use your Pivots will be the same, assuming that even with different time zones traders are able to find pretty close and quite often exact the same pivot point levels = levels of support and resistance, where everyone hits the same button at the same time.

Pivot points outperform other trading techniques and indicators also because they are predictive as opposed to lagging.

Because so many traders worldwide use Pivot points for trading, Forex market reacts at these levels in a quite predictable manner, respectinging support and resistance levels and creating a lot of trading opportunities.

Profitable trading!

Calculate Pivot points


How to calculate Pivot points?

Pivot levels are derived from previous day High, Low and Close price values. Thus, every new day Pivot points must be reset using the newest data. As a rule traders take the time range from midnight to midnight, e.g. from midnight price bar to
midnight bar.
Later we will introduce some traders' tricks about the timing.

Pivot points study provides traders with 5 major levels:

R2 — Second Resistance
R1 — First Resistance
PP — Pivot Point
S1 — First Support
S2 — Second Support

There are also additional levels, such as R3, S3 — third resistance and support, as well as Mid-points — middle levels between the major levels.


There are no limits on how many Pivot levels to use, however, one should remember, that making complex charts makes trading complicated as well. We would suggest sticking to 5 major Pivot point levels, around which most of the price action takes place.

The formula for calculating Pivot points is next:

Major 5 levels:

R2 = Pivot + (High — Low)        (same as R2 = Pivot + (R1 — S1))
R1 = 2 * Pivot — Low
Pivot = (High + Close + Low) / 3
S1 = 2 * Pivot — High
S2 = Pivot — (High — Low)      (same as S2 = Pivot — (R1 — S1))

Additional levels:

R3 = High + 2 * (Pivot — Low)
S3 = Low — 2 * (High — Pivot)
Midpoint between R1 and R2 = R1 + (R2 — R1) / 2
Midpoint between Pivot Point and R1 = Pivot + (R1 — Pivot) / 2

Pivot point Terminology

Before we speak about how to calculate and use Pivot point levels, let's define a few terms we will be using here:


PIVOT POINT is the point where the market reverses. It is a turning point. If the market is trading above Pivot Point it is considered to be a bull market (buyers are dominant), once it goes below the Pivot Point — it becomes a bear market (sellers are dominant).

RESISTANCE is a high point in the market where buyers meet strong opposition of sellers. A rising market reaching resistance has big potential of falling back down.

SUPPORT is a low point in the market where sellers meet strong opposition of buyers. A falling price reaching support has a big chance of climbing back up.

Support and resistance levels are difficult to break through, but they do fail, otherwise the price would be all the time going in one direction only...

There is a rule that once a support or resistance level is broken it becomes the opposite force: a broken support will become a resistance, and a broken resistance serves as a future support.

Let's look at the picture to see how it works:


Pivot point trading emphasizes on the importance of such support and resistance levels and its theory is based solely around those levels.

Forex Trading Systems


Why there is so much talk about having a Forex trading system?

If you want to be consistently successful in Forex, you need a Trading System, and here is why:

- Without a trading system you won't be able to analyse what you did right and what you did wrong.

- Without a trading system your trading preferences will change all the time: every new trade could easily have different reasons behind it.

- Without a trading system you can be late on entries due to constant hesitation as a result of battling with your intuition or a sudden second opinion.

- Without a trading system you'll have more doubts about the best time to exit a trade or the best place to keep a protective stop.

- Without a trading system you cannot trade consistently and demand a disciplined trading from yourself.

- Without a trading system you cannot fully work out your money management and risks.

- Without a trading system you'll be prone to fear of losing and every time you would need to regain the confidence.

All-in-all it is difficult to trade Forex without a trading system

So, you've found a good Forex trading system. Now what?

Most obviously you'll begin testing it on your Forex demo account.

But how about improving it? Does your new trading system have everything for you to trade currencies successfully?

Keep on reading, because we're determined to steer you in the right direction, and as you understand our message, you'll be improving twice as fast on your way to success!

Copyright © Myfxindicators.blogspot.com All Rights Reserved

Trend vs Trading Range-2

Does anyone trade during range bound markets?


Yes, many do.

The first group consists of traders who don't know yet that they are trading in a ranging market. Such unawareness often results in a losing streak for them.

The second group consists of prepared traders, who intentionally came to take advantage of the range bound conditions.

In order to trader profitably in range bound markets one has to have a special range bound trading strategy for that.
Usually such strategies consist of momentum and volatility indicators like Bollinger bands, RSI, Momentum indicator etc.
For example, with Bollinger bands indicator traders will be looking to trade off the upper and lower bands, where the market would be expected to reverse in order to continue its ranging path.

Profitable trading!

Copyright © Myfxindicators.blogspot.com All Rights Reserved

Trend vs Trading Range


Traders may get confused telling a trend from a trending range while it is very simple to distinguish both.

Trading range does not present a clear picture of the market direction. It makes it difficult to tell whether the market is heading up or down.

That's because traders could not find those familiar patterns of higher highs and higher lows (for uptrend) or lower lows and lower highs (for downtrend). What traders do see is randomness in tops bottoms formations order.

Let's look at trading range illustration:


So what we can see is that trading range is actually a sideways pattern. It can be spotted often after a strong market move or near important support resistance levels where the market is trying to regain its strength to advance to the next level.

It is quite difficult to take right trading decisions in a ranging market. Therefore once spotted, it would be a good idea to walk away from charts for a while.

Trend trading used by pros

If you ask an experienced trader how he plans his trading session, the answer will be: "I open my charts and the first thing I want to know is Where the trend is going".
That's right, the examination of the market trends is what every analyst do daily.

How to spot a trend?

There are many simple ways to spot a trend:

1) Visual, where you zoom out the charts till you can see price direction clearly.
Zoom in — and the market noise is back...

2) By using indicators. Forex example, 200 SMA. If the market is trading above 200 SMA — that's a bullish market, everything below 200 SMA indicates bearish trend.

3) By using other trend following indicators.

4) Or by drawing trend lines! Simpy connet lower lows on your chart till you have a good visible trend line. Then do the same for higher highs.
What you'll get will be either a channel Up or a channel Down. Now it's easy to tell which direction the price is heading.


Forex Trend Trading

Are you trading with a TREND?


To be consistantly profitable in Forex, traders should be able to identify market trends.
Why do you need to know about trends in Forex? The answer is simple: when you know trend direction
you can increase your chances to profit from a market move by opening a position in the direction of the trend. Counter trend traders can be often punished by the Forex market.

How to spot a trend? Any novice trader should be able to see simple slopes and hills on the chart created by the market price, a trained trader is able to see certain chart patterns.
When the market moves it does so in a certain way, creating a pattern — a set of waves.
The price makes peaks and valleys, or they are also called Tops and Bottoms.


Higher tops and higher bottoms will tell Forex trader that uptrend is in place.
On the contrary, lower tops and lower bottoms suggest a downtrend.

A good clean trend in a well trending market is one of the favorite trading environments for all Forex traders to trade in.

Forex Trend Lines

Forex Trend Lines


Plotting a trend line on a Forex chart gives very valuable information.
Not only the trend line will show a current trend (direction) of the price move, it will also depict points of support and resistance levels for market price.

In addition, it will also help to determine good entry and exit points, best positioning for profit taking and placing protective stops.
This very simple, but yet quite powerful tool will be one of the crucial indicators of possible trend reversal (when market price starts move in the opposite direction).

So, shall we learn how to draw trend line to make it our good friend in profitable forex trading?

In the uptrend market trend line is drawn below the pattern formation; in the downtrend — above. (That is why when the trend is going to change our trend line will be crossed, which therefore will give us a
signal that the price can start moving in another direction.)


In the uptrend, Forex trend line is drawn through the lowest swing-points of the price move.
Connecting at least two «lowest lows» will create a trend line.

In the down trend, trend line is drawn through the highest swing-points of the price move.
Connecting at least two «highest highs» will create a trend line.

A trend line confirms its validity when the price respects this line. The more «lowest lows» / «highest highs» the trend line contains, the stronger it becomes.


Another sample of drawing trend lines: main and inner downtrend lines.


Fibonacci retracement and extension

How to calculate Fibonacci retracement and extension levels


Three most used Fibonacci retracement levels are 0.382 or 38.2%, 0.500 (50%) and 0.618 (61.8%).

Three most used Fibonacci extension levels are 0.618, 1.000 and 1.618. Also 1.382 extension can be applied as well.

Let's take a look at the next picture:


In the example above we are in the uptrend. Lowest swing — point A — is 120.75; 
highest swing — point B — 121.44.

To calculate retracement levels and enter Long at some point C we do next:

Calculations for Uptrend and Buy order:

B — A = ?
121.44 — 120.75 = 0.69

0.382 (38.2%) retracement = 121.44 — 0.69 x 0.382 = 121.18
0.500 (50.0%) retracement = 121.44 — 0.69 x 0.500 = 121.09
0.618 (61.8%) retracement = 121.44 — 0.69 x 0.618 = 121.01

Fibonacci retracement levels formula for an uptrend:

C = B — (B — A) x N%

Now we need to calculate extension levels:

0.618 (61.8% ) extension = 121.44 + 0.69 x 0.618 = 121.87
1.000 (100.0%) extension = 121.44 + 0.69 x 1.000 = 122.13
1.382 (138.2%) extension = 121.44 + 0.69 x 1.382 = 122.39
1.618 (161.8%) extension = 121.44 + 0.69 x 1.618 = 122.56

Fibonacci extension levels formula for an uptrend:

D = B + (B — A) x N%

Our next example is downtrend.


Highest swing — point A — is 158.20; lowest swing — point B — is 156.44.

Calculations for downtrend and Sell order:

A — B = ?
158.20 — 156.44 = 1.76

Because of the downtrend we need to add to the lowest point B to find retracement.

0.382 (38.2%) retracement = 156.44 + 1.76 x 0.382 = 157.53
0.500 (50.0%) retracement = 156.44 + 1.76 x 0.500 = 157.32
0.618 (61.8%) retracement = 156.44 + 1.76 x 0.618 = 157.11

Fibonacci retracement levels formula for downtrend:

C = B + (A — B) x N%

Now let's find Fibonacci extension levels (downtrend):

0.618 (61.8%) extension = 156.44 — 1.76 x 0.618 = 155.35
1.000 (100%) extension = 156.44 — 1.76 x 1.000 = 154.68
1.382 (138.2%) extension = 156.44 — 1.76 x 1.382 = 154.01
1.618 (161.8%) extension = 156.44 — 1.76 x 1.618 = 153.59

Fibonacci extension levels formula for downtrend:

D = B — (A — B) x N%


Fibonacci method in Forex real forex chart

Now let's have a look at a real forex chart.


Same steps will also apply to downtrend price movement.


A little bit of theory:
Leonardo Fibonacci is a founder of a simple series of numbers related to the natural proportions of things in the universe. Fibonacci numbers create ratios that arise from the following number series: 0, 1, 1, 2, 3, 5, 8, 13, 21, 34, 55, 89, 144: Calculated this way: 0+1=1, 1+1=2, 1+2=3 and so forth.

The ratio of any number in relevance to the next higher number is 0.618. E.g. 55/89=0.618. There is no need to perform calculation each time you get into a trade, your trading platform is going to do it for you.


Fibonacci method in Forex

Straight to the point:


Fibonacci Retracement Levels are:
0.382, 0.500, 0.618 — three the most important levels
Fibonacci retracement levels are used as support and resistance levels.

Fibonacci Extension Levels are:
0.618, 1.000, 1.618 — three the most important levels
Fibonacci extension levels are used as profit taking levels.

So, what we will learn today is how to apply Fibonacci tool and how to interpret results that we see on the screen.

To set up Fibonacci on the chart we need to find out:
1. Is it uptrend or downtrend?
2. Highest and lowest swings in the chart formation (A, B points).
And go with the trend!

So, click on Fibonacci tool from trading platform that you use. Now, as shown on the Figure 1:

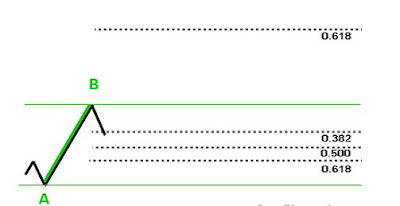
We have an uptrend. A — our lowest swing, B — our highest swing. So, we will look to BUY some lots at the good lowest price and go up with the trend.

Click on A and drag your cursor to B, click. There you go! You must see different lines appeared on your chart. Those lines are called Fibonacci Retracement and Extension Levels.

So, what we are expecting is next: the price should retrace (go down) from point B to some point C, and then continue up in the direction of the trend.
Those three dotted lines (0.618, 0.500, 0.382) at the bottom on our picture shows three Fibonacci retracement levels where we expect the price to take a U-turn and go up again. There we will place our BUY order.

The best situation would be to buy at the lowest level — 0.618 — point C. And on practice the price usually gives us this chance.However, 0.500 is also a good level to place a BUY order.

Well, let's take a look at the progress.


The price has successfully reached the lowest 0.618 point and made a U-turn.
So, now when we have our BUY order placed at desired point C, we would like to set some targets to take our profit in the future. For profit taking levels we use Fibonacci extension levels (0.618, 1.000, 1.618). The most common is 0.618 extension level, but when the price shows good potential to reach next 1.000 or even 1.618 level, you can leave your trade to get that target too.
We will choose 0.618 extension level as our profit target, and according to Figure 2, D is our point for taking profit.

Important note: in this Fibonacci tutorial 0.618 extension level (as well as 1.000, 1.618 levels) are calculated in relation to the point B, which means that B point represents a 0% extension. Some Forex traders like to start counting from point A, then the distance from A to B would be already 100% of the price move. Thus moving further from B would be 1xx.x %.
For example: looking at the last picture, if to start counting from point A, then point D would be a 1.618 Fibonacci extension level or a 161.8% of the price move.

Forex Money Management-5

5. A practical example of applying money management rules:


Risking no more than 2-3% of the total account per trade... How does it work in practice?
Let's use an example to understand it.

We have opened a trading account of $1000 USD with a broker and got 20:1 leverage. So, now we have leveraged ourselves to $20 000 USD to begin trading with.

More money means a higher trading power. Correct. But, the higher the trading power, the higher the risks; and when we talk about risks we talk about a real account value which will decrease with every loss sustained during trading. So, when we say risking no more than 2-3% of a total account value we mean the real account value — which is $1000 USD in our case.

Now, let's start trading and do the math.
Let's say, we have decided to risk 2% of the account in each trade.
$1000 x 2% = $20 USD.
This means that when the price goes against us, we will need to be out of the trade once we are $20 dollars down

Ok, time to trade. Our trading power measures $20 000 USD (thanks to our leverage).

What will happen if we try to trade them all at once: for one $20 000 dollar trading lot order our Forex broker gives us a pip value of $2 dollars. This means that with each pip gained we will have +$2 USD in our pocket. But this also means
that with each pip lost our real account will shrink by $2 dollars.
Since we can afford to lose only $20 dollars in one trade, we'll exiting a trade once the market makes... -10 pips! Yes, only 10 pips is required this time to reach our 2% limit.
10 pips * $2 USD per 1 pip = $20 dollars, which is our 2% account limit according with the money management rule we've chosen to follow.

Now, let's try to trade a $10 000 dollar position. The pip value for this position size will be $1 USD.
The math goes as follows:
we can stay in trade until market makes -20 pips against us. Yes, this time we can sustain a bigger market shift.


If we decrease our trading lot to $5000 USD, our sustainability will raise to -40 pips against our trade. (The pip value for $5000 dollar lot will be $0.50 cents).
And so on.

As you can see, with the money management rule in place our real account is under control. And even if leverage allows trading larger positions, the risks should be always under control.

Good trades!
FX Leader

Forex Money Management-4e

5. Protective stops are extremely important during huge rallies


Simply because too many traders react on those "rally events", one can face a situation when it becomes impossible to access a trading platform in order to close the order or at least place a protective stop. When there is a serious shake up in the market (due to news announcements, economical, political and other events), trading servers can be quickly overloaded and can cause trading delays or not respond at all. In such cases Forex traders become helpless while overloaded and can cause trading delays or not respond at all. In such cases Forex traders become helpless while money is draining out of their accounts. The only option here would be to call your Forex broker and make voice orders. Again, there will be no guarantee that brokers aren't overloaded with calls at this moment as well, and so trader should wait... dreaming how simple things could be if a stop loss was there.

Wish you to make wise decisions and never experience such troubles!


Profitable trades!
FX Leader

Forex Money Management-4d

4. Volatility related Stop


Price volatility can also be used when placing a Stop loss order. During active hours & high market volatility, traders should place stops further than usually to avoid seldom price noise and react only to major price changes. During the periods of a low market volatility, protective Stops should be placed closer in order to react in time should the market accelerate.


One of the good technical tools to measure price volatility is Bollinger bands indicator.

Let's take a look at the following example:


Forex Money Management-4c

3. Margin Stop


The method is not recommended for novice traders.
It represents a quite interesting approach that would rather suit Forex traders, who like placing all money at once on a particular trade. But at first, a trader should divide his account into several equal parts to ensure that the whole capital will  not be blown away in one shot. Supposing that a trader plans to trade $10 000 USD lots, it's suggested that an account opened with a broker "weights" in between $1000 to $2000 USD.


Then a "play" with a margin starts. Depending on the leverage that is going to be used and carefully choosing a lot size, a trader can calculate the point where a margin call will occur. This point will work as a global stop loss, which if crossed, will cause the account to be closed automatically.

A predetermined risk, no concerns about the manual stop loss, a maximum trading position size — all that creates the whole new approach to trading Forex.

Forex Money Management-4b

2. Chart based Stop


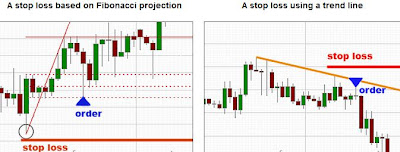
There are several approaches to placing protective stops:
- stops based on swings high / low,
- stops using trend lines,
- Fibonacci related stops, etc.

Let's take a look at some examples below:
A stop loss based on the last swing low (double-bottom pattern


Chart based stops are widely used in combination with simple equity stops.


Forex Money Management-4a

Learn to use Stop Loss effectively


Still unsure whether you need it?


Every day hundreds of Forex traders blame themselves for being so naive and trading without protective stops. Hundreds of others lose funds worth weeks, months & even years of trading just only in one very unsuccessful trade.

And yet another hundreds of traders, having heard dozens of times about importance of protective stops, open new trades ignoring the well known money management rules.

Stop loss isn't often a favorite tool for many Forex traders as it requires taking necessary losses, calculate risks and foresee price reversals. However, a Stop loss tool in hands of a knowledgeable trader becomes rather a powerful trading weapon than a cause of disappointment and painful losses.

Every trader is free to develop his / her own trading style and implement own money management rules. We will go over several methods of using Stop losses.

1. Simple equity Stop


this rule, a trader would place an order and based on a lot size would calculate amount of pips required to reach the 
It's an important money management rule: not to risk more than 2-3% of the total account per trade. According to 
limit of 2-3% of the total account balance (and a stop loss will be placed at that point).

For example: a trader has $1000 USD account, he places a buy order of 4000 units on EUR/USD, which will give him on  average $0.40 cents per 1 pip. Since 2% risk that he is willing take equals $20 USD ($1000 * 2%), calculations will be next: $20 / $0.40 cents = 50 pips is the limit for this trade.

Forex Money Management-3

3. Calculate risk / reward ratio before entering a trade


When chances to win in a trade are smaller than potential losses, don't trade! Remember — staying aside is a position.


For example:
losing 40 pips versus winning 30 pips,
losing 20 pips versus winning 20 pips,

both examples are showing a bad risk management.


Before entering a trade, reassure that risk / reward ratio is at least 1:2 (but ideally 1:3 or higher), which means that chances to lose are tree times less than promises to win. For example: 30 pips of a possible loss versus 100 pips of a potential win is a good trade to consider taking.


Adopting this money management rule as a must, in the long run it will dramatically increase your chances to succeed in making stable profits.

Next chart shows the risk / reward rule in practice.


10 trades with 1:3 risk / reward ratio were conducted.
A trader was losing only $100 in a trade when he was wrong, but was winning $300 in each profitable trade.


As we can see, using 1:3 risk / reward ratio constantly and being successful only 50% of the time, anyone can make a profit in the end. The higher the reward ratio (compared to the risk ratio) the better are chances to end up in profit.


Forex Money Management-2

2. Returning the lost capital is harder that it seems to 


Let's take a look at calculations where a trader has lost some part of his account. How much effort will it take to recover the original account balance?


Now, here is a challenge: try on your demo account to gain a return of 300% or at least 100% of your original 
account trading as it were the real money. Will that be easy? I don't think so. Can you prove me wrong?

Forex Money Management-1


Money management is a way Forex traders control their money flow: literally IN or OUT of own pockets... Yes,
it's simply the knowledge and skills on managing own Forex account.

There are several rules of good money management:


1. Risk only small percentage of a total account

Why is it so important?
The main idea of the whole trading process is to survive! 
Survival is the first task, after which comes making the money.

One should clearly understand that good traders are, first of all, skillful survivors. Those who also have deep pockets can additionally sustain larger losses and continue trading under unfavorable conditions, because they are financially able to. For an ordinary trader, the skills of surviving become a vital "must know" requirement to keep own Forex trading accounts "alive" and be able to make profits on top.

Let's take a look at the example that shows a difference between risking a small percentage of capital and risking a larger one. In the worst case scenario with ten losing trades in a row the trading account will suffer this much:


Apparently, there is a big difference between risking 2% and 10% of the account balance per trade. A trader who has made 10 trades risking only 2%, under the worst conditions would lose only 17% of his initial investment. The same trader who had been exposing 10% of the balance per trade would end up losing over 60% of his initial investment. As you can see, this simple decision — a money management approach — can have serious consequences if misjudged.

Fibonacci Fan

Fibonacci Fan is another Fibonacci retracement tool that takes both price and time into consideration.Comparing to horizontal Fibonacci lines it offers an additional feature — price movement projection far further in time.

The price projection is based on fan-like trend lines that represent already familiar to us Fibonacci numbers: 0.382, 0.500 and 0.618.

That how it looks on the sketch:

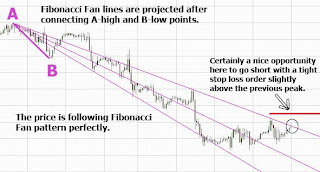
To place Fibonacci Fan on the chart, choose Fibonacci Fan tool from menu on your trading platform and then look for the highest high and lowest low points (in other words two opposite peaks) at any given time to plot the tool on. Simply click on one peak and drug all the way to the other peak, the trading platform will build a fan for you.

Let's now take a look at the real chart:


Fibonacci Fan represents price future support and resistance levels. Traders can expect for the price either to stay in the fan and move in between lines, or break out of it.

When a price holds at any Fan line it indicates presence of support/resistance there. Once the price breaks through the line, it won't usually stop till the next Fan line is met. If the price quickly passes a Fan line (which means there was no support/resistance there), it will freely move to the next Fan line.

Even trading outside the Fibonacci Fan, price can find strong support/resistance when approaching Fibonacci Fan line.


So, Fibonacci Fan gives traders a simple but effective way to predict future price movements.
However, it is recommended that Fibonacci Fan tool be traded along with other indicators or tools to avoid fake signals.